
Most speed advice online is years out of date. Here are Google's actual thresholds for LCP, INP and CLS, how to find which one you are failing, and the specific fix for each.
Most website speed optimization advice circulating online was written for a web that no longer exists. It tells you to merge every stylesheet into one file, to shard your assets across multiple subdomains, and to chase a metric Google formally retired on 12 March 2024. Follow it carefully and you can spend a fortnight making a site measurably worse.
This guide covers what matters now: the three thresholds Google measures, how to work out which one you are failing, and the specific fix for each. Every figure is Google's published number, linked to its source.
The three numbers that decide pass or fail
Core Web Vitals reduce page speed to three measurements. A page passes only if it meets all three. Everything else, including your Lighthouse score, your total page weight and your request count, is diagnostic detail rather than the grade.
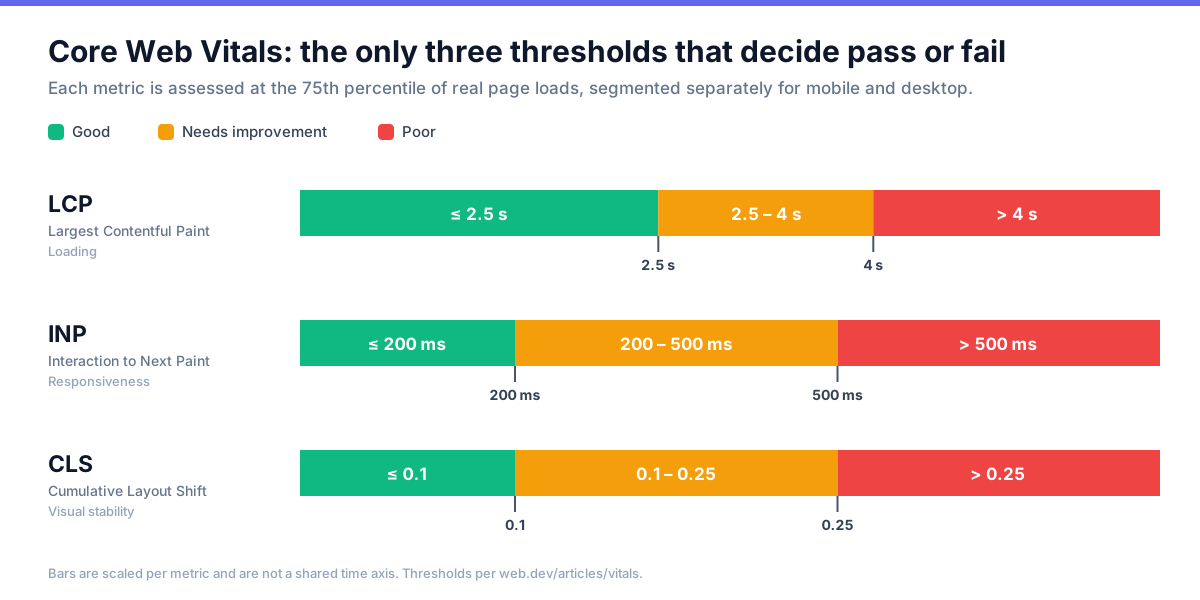
The detail that catches most people out is the 75th percentile. Google does not score your average visitor. It takes the trailing 28 days of real Chrome traffic, sorts every page load, and grades the experience at the 75th percentile, so three quarters of your visits must hit the target. Your own laptop on office fibre is, statistically, the visit that matters least.
Lab data and field data are not the same thing
This distinction resolves the single most common complaint we hear: "PageSpeed Insights gave me 98, so why does Search Console say my pages are failing?"
- Lab data (the Lighthouse score out of 100) is a simulation. One synthetic load, on a throttled connection, in a data centre. It is reproducible and useful for debugging, and it is not what Google ranks on.
- Field data (the Chrome User Experience Report, or CrUX) is what your real visitors experienced on their real devices over a trailing 28-day collection period. This is the assessment that counts.
A 100/100 Lighthouse score and a failing Core Web Vitals assessment can coexist quite happily. When they disagree, the field data wins. The rolling collection window also means your fix will not show up in Search Console for several weeks. Judge your work on field data, and be patient with it.
If your checklist still mentions First Input Delay, bin it
FID stopped being a Core Web Vital on 12 March 2024, when Interaction to Next Paint replaced it. It was dropped from Search Console immediately and phased out of the other tools over the following six months.
This is not pedantry. FID measured only the input delay: how long the browser took to begin running your event handler. A page could score a perfect FID while the handler itself locked the main thread for over a second, because FID stopped counting before any of that happened. INP measures the whole interaction, through to the next painted frame. Sites that comfortably passed FID routinely fail INP, and the work required to fix it is entirely different.
If a speed guide published after March 2024 still lists FID among the Core Web Vitals, it was not checked against the source. Treat the rest of its advice with the same suspicion.
LCP: split one number into four problems
Largest Contentful Paint measures when the biggest element in the viewport finishes rendering, usually a hero image, a video poster, or a large block of heading text. On most sites it is the first vital to fail, and it is the easiest to fix once you stop treating it as a single number.
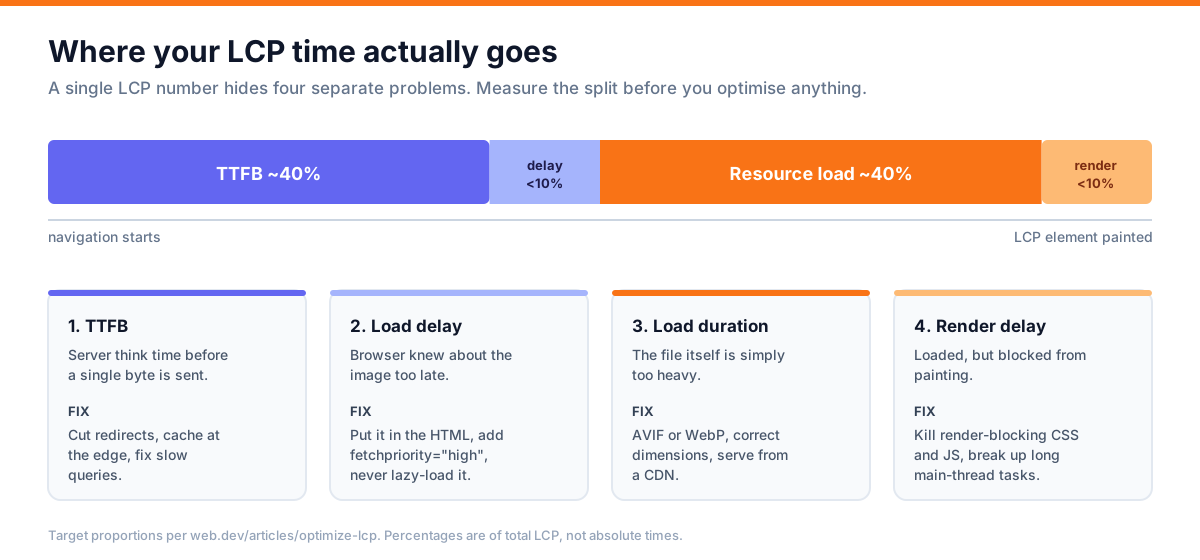
Measure the split first. A 4-second LCP caused by a slow database query and a 4-second LCP caused by a lazy-loaded hero image look identical in the score and share no fix whatsoever.
The mistake we find most often
Someone applies loading="lazy" to every image on the site, including the hero. It is a reasonable-sounding instinct and it directly sabotages LCP: the browser now deliberately defers the one image the metric is timing.
Your LCP image should be the opposite: discoverable in the initial HTML and explicitly prioritised.
<!-- Hero image: never lazy-load this -->
<img src="/images/hero.avif"
     alt="..."
     width="1200" height="600"
     fetchpriority="high"
     decoding="async">

<!-- Every image below the fold: lazy-load these -->
<img src="/images/feature.avif" alt="..." width="600" height="400" loading="lazy">
Two rules cover most cases. Above the fold, use fetchpriority="high" and never loading="lazy". Below the fold, always loading="lazy". If the hero is set by CSS background-image, the preload scanner cannot find it early, which adds load delay before the request has even started.
Bringing TTFB down
Time to First Byte is not itself a Core Web Vital, but it is the floor under your LCP: you cannot paint before the bytes arrive. Google's guidance is 0.8 seconds or less, with anything beyond 1.8 seconds rated poor. Note that this is 800 ms, more forgiving than the lower figures that circulate in copied-and-pasted advice.
Where the time usually goes: unindexed database queries, N+1 query patterns in the ORM, chains of redirects, uncached template rendering, and origin servers geographically distant from users. Page caching and a CDN address the symptom well; a slow query on a hot path needs fixing at the source. Our DevOps and cloud infrastructure team handles this end of the problem when it turns out to be a server issue rather than a front-end one.
INP: it is nearly always your JavaScript
INP measures responsiveness: the lag between a user acting and the screen visibly changing. Clicks, taps and key presses count. Scrolling, hovering and zooming do not.
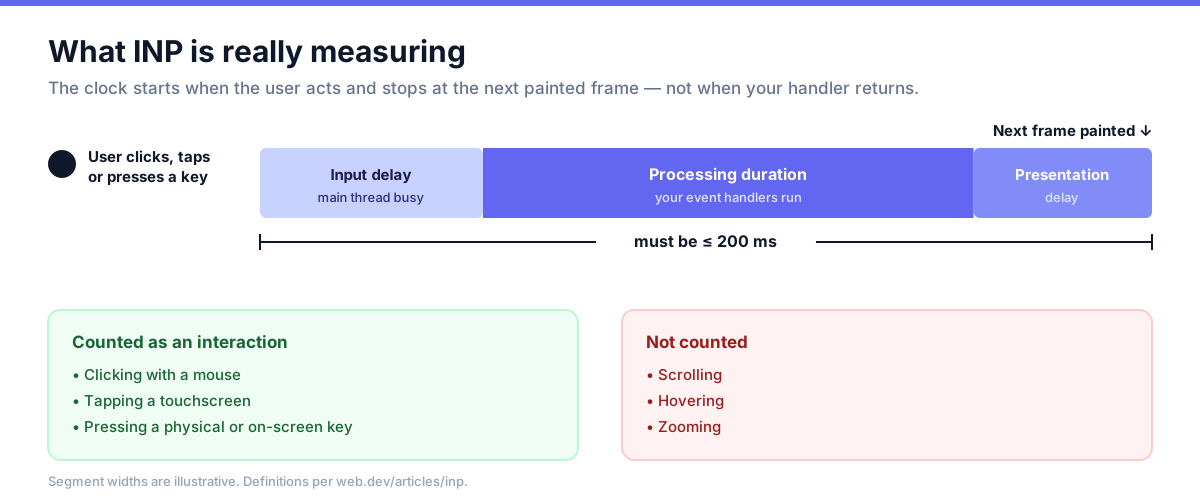
The clock does not stop when your event handler returns. It stops when the browser paints the next frame. Updating application state in a few milliseconds and then forcing a layout of several thousand DOM nodes is a slow interaction, however fast the handler looked in isolation.
In our experience the usual culprits, in order: third-party tags (chat widgets, heat-mapping, tag managers, consent banners), heavy client-side frameworks re-rendering more of the tree than necessary, and long tasks that monopolise the main thread while the user is trying to interact.
The most effective single change is usually to break up long tasks so the browser gets a chance to respond between chunks:
// Blocking: one long task, the UI is frozen throughout
function processAll(items) {
  items.forEach(expensiveWork);
  render();
}

// Better: yield to the main thread between chunks
async function processAll(items) {
  for (const [i, item] of items.entries()) {
    expensiveWork(item);
    if (i % 50 === 0) {
      // Chromium: scheduler.yield(); fallback works everywhere
      await (globalThis.scheduler?.yield?.() ??
             new Promise(r => setTimeout(r, 0)));
    }
  }
  render();
}
Then audit your third parties honestly. Every marketing tag someone requested two years ago is still executing on every page load. Removing a few unused scripts often beats weeks of hand-optimising your own code.
CLS: reserve the space before you need it
Cumulative Layout Shift measures content jumping about while the page loads, the reason you tap the wrong link because a banner loaded above it. It is the cheapest vital to fix and the most annoying to leave broken.
Nearly all of it comes down to reserving space in advance:
- Always set
widthandheighton images and video. Modern browsers derive an aspect ratio from these attributes and hold the space open before the file arrives. Responsive CSS still overrides the actual rendered size. - Give ads, embeds and iframes a fixed container with
min-heightoraspect-ratio. Third-party content is the largest single source of shift on most commercial sites. - Handle web fonts deliberately.
font-display: swapavoids invisible text but causes a reflow when the real font loads. Preload the font and pick a fallback with similar metrics;size-adjustandascent-overridelet you match them closely, and Chrome's guide to font fallbacks shows how to work out the values for your font pair. - Never inject content above existing content after load. Cookie bars, promo strips and "you have 1 new message" banners belong in space already reserved, or in an overlay that shifts nothing.
/* Hold the space open before the embed arrives */
.video-embed {
  aspect-ratio: 16 / 9;
}
Speed advice that has quietly expired
These recommendations were genuinely correct once. Under HTTP/2 and HTTP/3, which effectively all modern hosting speaks, several are now actively counterproductive.
| Old advice | Why it no longer holds |
|---|---|
| Combine all CSS and JS into one file | HTTP/2 multiplexes many requests over one connection, so the per-file penalty is small. One giant bundle means any one-line change invalidates the whole cached file. Bundle sensibly by route rather than merging everything. |
| Shard assets across subdomains | A workaround for the small number of parallel connections browsers open per origin under HTTP/1.1. Under HTTP/2 it forces extra DNS lookups and TLS handshakes and breaks multiplexing. Straightforwardly harmful now. |
| Use CSS image sprites | Same reasoning. You now download one large sprite to show two icons, and cannot lazy-load any of it. Use SVG. |
| Optimise First Input Delay | Retired 12 March 2024. Optimise INP, which measures the entire interaction rather than just the delay before it starts. |
| Lazy-load every image | Correct below the fold, damaging above it. Lazy-loading your hero image directly delays LCP. |
| Chase a 100/100 Lighthouse score | Lab simulation, not the ranking input. Field data from real visitors is what Google assesses. |
The order we actually work in
Sequence matters, because the early steps frequently make the later ones unnecessary.
- Get field data first. Check the CrUX report in PageSpeed Insights and the Core Web Vitals report in Search Console. Establish which vital is failing, on which template, on mobile or desktop. Optimising without this is guesswork.
- Fix the failing vital only. If you pass LCP and fail INP, compressing images achieves nothing. Solve the one that is failing.
- Audit third-party scripts. Usually the highest ratio of improvement to effort on the whole list, and it costs nothing but a conversation about which tags are still needed.
- Sort out images. AVIF or WebP, correctly sized,
widthandheightalways set, lazy below the fold and prioritised above it. - Then the server. Caching, CDN, compression, and the slow queries behind a poor TTFB.
- Re-measure after 28 days. The field data window is a trailing 28-day period that updates gradually. Fixes do not appear overnight, and reacting to lab numbers in week one leads to undoing good work.
Frequently asked questions
Is site speed a Google ranking factor?
Yes, though a modest one. Core Web Vitals form part of the page experience signals. They will not lift weak content above strong content, but between two comparable pages the faster one has the advantage, and speed affects conversion regardless of ranking.
How long until improvements show in Search Console?
About four weeks. Field data uses a trailing 28-day collection period, so a fix deployed today only appears fully once the window has cycled past the old measurements.
Why does PageSpeed Insights give me different scores each run?
The Lighthouse portion is a live simulation, sensitive to server load and network conditions at that moment. Variation of several points between runs is normal. The CrUX field data on the same page is stable; use it as the source of truth.
Does a CDN fix Core Web Vitals?
It helps TTFB and resource load duration, particularly for geographically distant visitors. It does nothing for INP, because that is your JavaScript executing on the user's device, and little for CLS. A CDN is worth having and is not a complete answer.
Is AMP still necessary for speed?
No. Google removed the AMP requirement for Top Stories in 2021. A well-built responsive site that passes Core Web Vitals competes on equal terms, without AMP's constraints.
Where this usually lands
Website speed optimization is diagnostic work before it is engineering work. The three thresholds are public, the tooling is free, and the 75th percentile of real visits tells you honestly where you stand. What separates a site that passes from one that does not is rarely knowledge of an exotic technique. It is fixing the right one of the three, in the right order, and resisting advice that expired several years ago.
If you would rather not do this yourself, we can run the same diagnosis on your templates through our web development service and tell you which vital is failing and why, rather than handing you a generic checklist. It sits naturally alongside technical SEO work, since both draw on the same field data. Send us the URL and we will say which of the three is costing you and what fixing it involves.